Selecting the correct maturity level for your project is important because it affects the reference class forecasts used in the analysis. In general, less mature projects are associated with higher overrun risk.
Different countries and organisations often use different names for business case stages. The forecasting calculator uses UK HM Treasury Green Book definitions. The Maturity Assessment helps make sure the correct level of maturity is entered into the calculator. It does this by scoring your project against 12 criteria (based on UK Gateway Review guidance) and calculating an average maturity score. That average score is then used to align your project's maturity with the business case stages defined in the Green Book. The matching stage is then entered into the forecasting tool, ensuring that your project's overrun risk is based on a maturity level that is consistent with the tool's assumptions.
Please note that the calculator should only be used for the following business cases: Low Maturity or Strategic Outline Business Case (SOBC), Medium Maturity or Outline Business Case (OBC), and High Maturity - Full Business Case (FBC). The calculator will not work for projects at First Suggestion, Works Beginning, and Works Complete maturity stages.
| Category | Score | First suggestion | Low Maturity — SOBC | Medium Maturity — OBC | High Maturity — FBC | Works Beginning — CCT | Complete |
|---|---|---|---|---|---|---|---|
| Business Case Development | No business case defined. | A preliminary business case is authorised for detailed investigation. Robust in principle: meets business needs, is affordable, achievable, with appropriate options. | A second iteration illustrating a preferred option is authorised. | A full business case confirming all material scope decisions, supported by supplier/partner information, is authorised. | No material scope changes awaiting decision. | Complete. | |
| Funding | No specific funding identified. | Funding is secured for development phases. | Funding is secured in principle for the whole project. | Funding is fully assured with adequate contingency for the entirety and potential risks. | Funding remains fully assured recognising changes and current cost/time projections. | Complete. | |
| Business Goals | No consideration of business goals. | Project assessed as likely to deliver business goals and support wider change. | Business goals objectively quantified and confirmed as a positive contribution. | Confirmed to deliver against quantifiable goals and change milestones. | Remains on track to deliver anticipated goals. | Complete. | |
| Outcomes & Benefits | No definition of outcomes or benefits. | Full scale, intended outcomes, timescales and external issues considered. Benefits identified with measures of success. | Outcomes and impact defined. Benefits objectively quantified. Objectives aligned with programme. | Business prepared for development, transition and operation. Objectives still aligned with wider strategy. | All areas aware of impact with plans to align. Indicators continue to match requirements. | Complete. | |
| Expert Advice | No expert advice allocated. | Expert advice being utilised to identify/analyse options. | Business Case supported by expert advice, no significant dissent to preferred option. | Full Business Case supported by expert advice, no significant dissent to full funding. | Current status supported by expert advice. | Complete. | |
| Definition of Scope | No definition of scope or requirements. | Scope and requirements are realistic, clear, unambiguous (RIBA Stage 1 or equivalent). | Scope well defined (RIBA Stage 2), option selection rationalised. | Scope predominantly signed off (RIBA Stage 3), no significant aspects still to develop. | Scope inclusive of changes fully signed off. | Complete. | |
| Feasibility Studies | No feasibility studies undertaken. | Feasibility studies completed, preferred way forward identified. | Essential surveys completed, confirm feasibility of option. | All initial surveys completed and confirm scope. | All ground/condition surveys concluded and confirm designs. | Complete. | |
| Supply Chain | No consideration of market interest. | Supply chain interest/ability considered, developed in dialogue with market. | Supply chain capability fully understood. Contract management strategy defined. | Contract strategies assured to deliver on time/budget. Business Case supported by supplier info. | Prices and schedule fully supported with firm prices from partners. | Complete. | |
| Project Management | No support for project identified. | Adequately managed with competent, resourced team. | Controls and organisation defined, financial controls in place, resources available. | Management controls in place through to completion. Plans are sound and achievable. | Project management disciplines robust, change managed diligently. | Complete. | |
| Risk Management | No consideration of risks. | Major risks identified, outline risk management plans developed. | All risks considered, accountability outlined, management plans active. | Risk/issue management plans in place and shared with suppliers/partners. | All risks under active management, forecasts reflect potential impact. | Complete. | |
| Delivery Plans | No plans created. | Plans for next stage, indicative delivery strategy to completion. | Plan through to completion is detailed and realistic. Delivery strategy robust. | Technical implications addressed (buildability, information assurance, frameworks). | Approved delivery strategy followed. Handover strategy being developed. | Complete. | |
| Approvals | No planning assumptions or external approvals. | Internal/external authority and stakeholder support exists. Planning assumptions appropriate. | All significant approvals on track. Compliance with requirements addressed. | Continuing support, all major approvals secured. Statutory requirements followed. | All required approvals received. | Complete. |
"The single most important piece of advice regarding how to increase accuracy in forecasting"
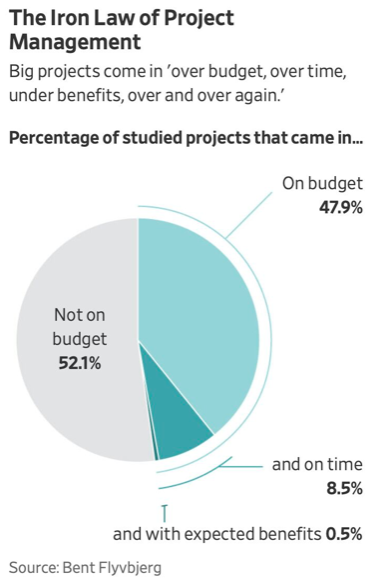
Big transport projects rarely unfold exactly as planned. Budgets stretch, timelines slip, and benefits erode. Only 40% of past BRT projects stayed within budget, and just 20% opened on time. For Urban Rail projects, only 25% stayed within budget, all heavy rail projects opened late, and half of light rail projects had delays.

Figure 1: Only 2/10 BRT projects opening on time visualized
This reduces value for money and investor confidence, undermines affordability, and limits their potential as sustainable transport solutions. These overruns and benefit shortfalls happen because planning is biased by the natural human tendency to be optimistic (optimism bias), or the real figures are deliberately misrepresented for political or commercial reasons (political bias)
The Urban Rail and BRT benchmarking tool helps planners take a more realistic view from the outset by applying Reference Class Forecasting (RCF) to projects. Instead of relying only on project-specific assumptions, it uses the “outside view” of how similar projects have actually performed to improve cost and schedule forecasting accuracy.
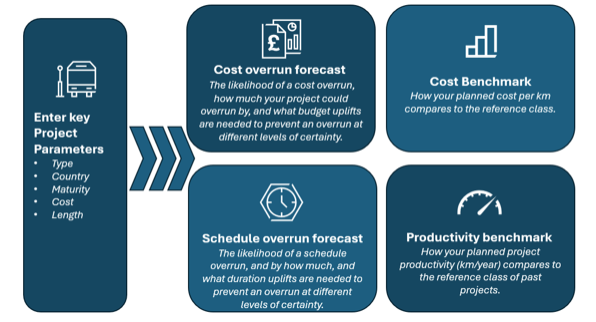
Enter your project details → The Tool selects a reference class → Your Benchmarks are generated
Selecting the right majority is crucial as it affects the reference class forecasts used in the analysis. In general, less mature projects are associated with higher overrun risk.
Different organisations and countries use different names for business case stages. This calculator uses UK HM Treasury Green Book definitions. Not sure where your project fits? The Maturity Assessment scores you against 12 criteria, calculates your maturity level, and maps it to the right Green Book stage automatically.
All costs are normalised to local currency using World Bank 2023 Purchasing Power Parity (PPP) factors. Your input cost in local currency is converted to PPP-adjusted USD for comparison with the reference class, then results are displayed back in your local currency.
The engine selects the appropriate statistical distribution based on:
The RCF approach assumes that past project outcomes provide a meaningful basis for forecasting future performance when appropriately segmented. It also assumes that variability and bias observed in historical data (particularly optimism bias and tail risk) are relevant to current projects. The tool assumes that users can reasonably classify projects into comparable categories and that project-specific factors can be captured in a structured way. Importantly, the approach does not assume perfect comparability; rather, it assumes that using empirical base rates provides a more reliable starting point than relying on unaided judgment.In short, the two key assumptions are that;
As with any empirical method, the quality of the output depends on the quality and relevance of the underlying data. In cases where the reference class is small (< 10) or projects are highly novel, the level of uncertainty increases and must be explicitly recognised. The approach is not designed to predict exact outcomes for individual projects, but to provide probabilistic ranges. It also requires disciplined use: misclassification of projects or overinterpretation of precision can reduce effectiveness. These limitations are addressed through transparent reporting, sensitivity analysis, and clear guidance on interpretation. On this tool:
We conducted an RCF exercise on BRT and Urban Rail projects to bridge the knowledge gap with evidence-based findings and enable more realistic transport planning. This included reviewing hundreds of projects across the globe, carefully cleaning and validating the data, and calculating cost and schedule benchmarks and overrun risk based on robust statistical testing. Figure 1 shows the key steps of our approach and Table 1 shows our final validated sample.
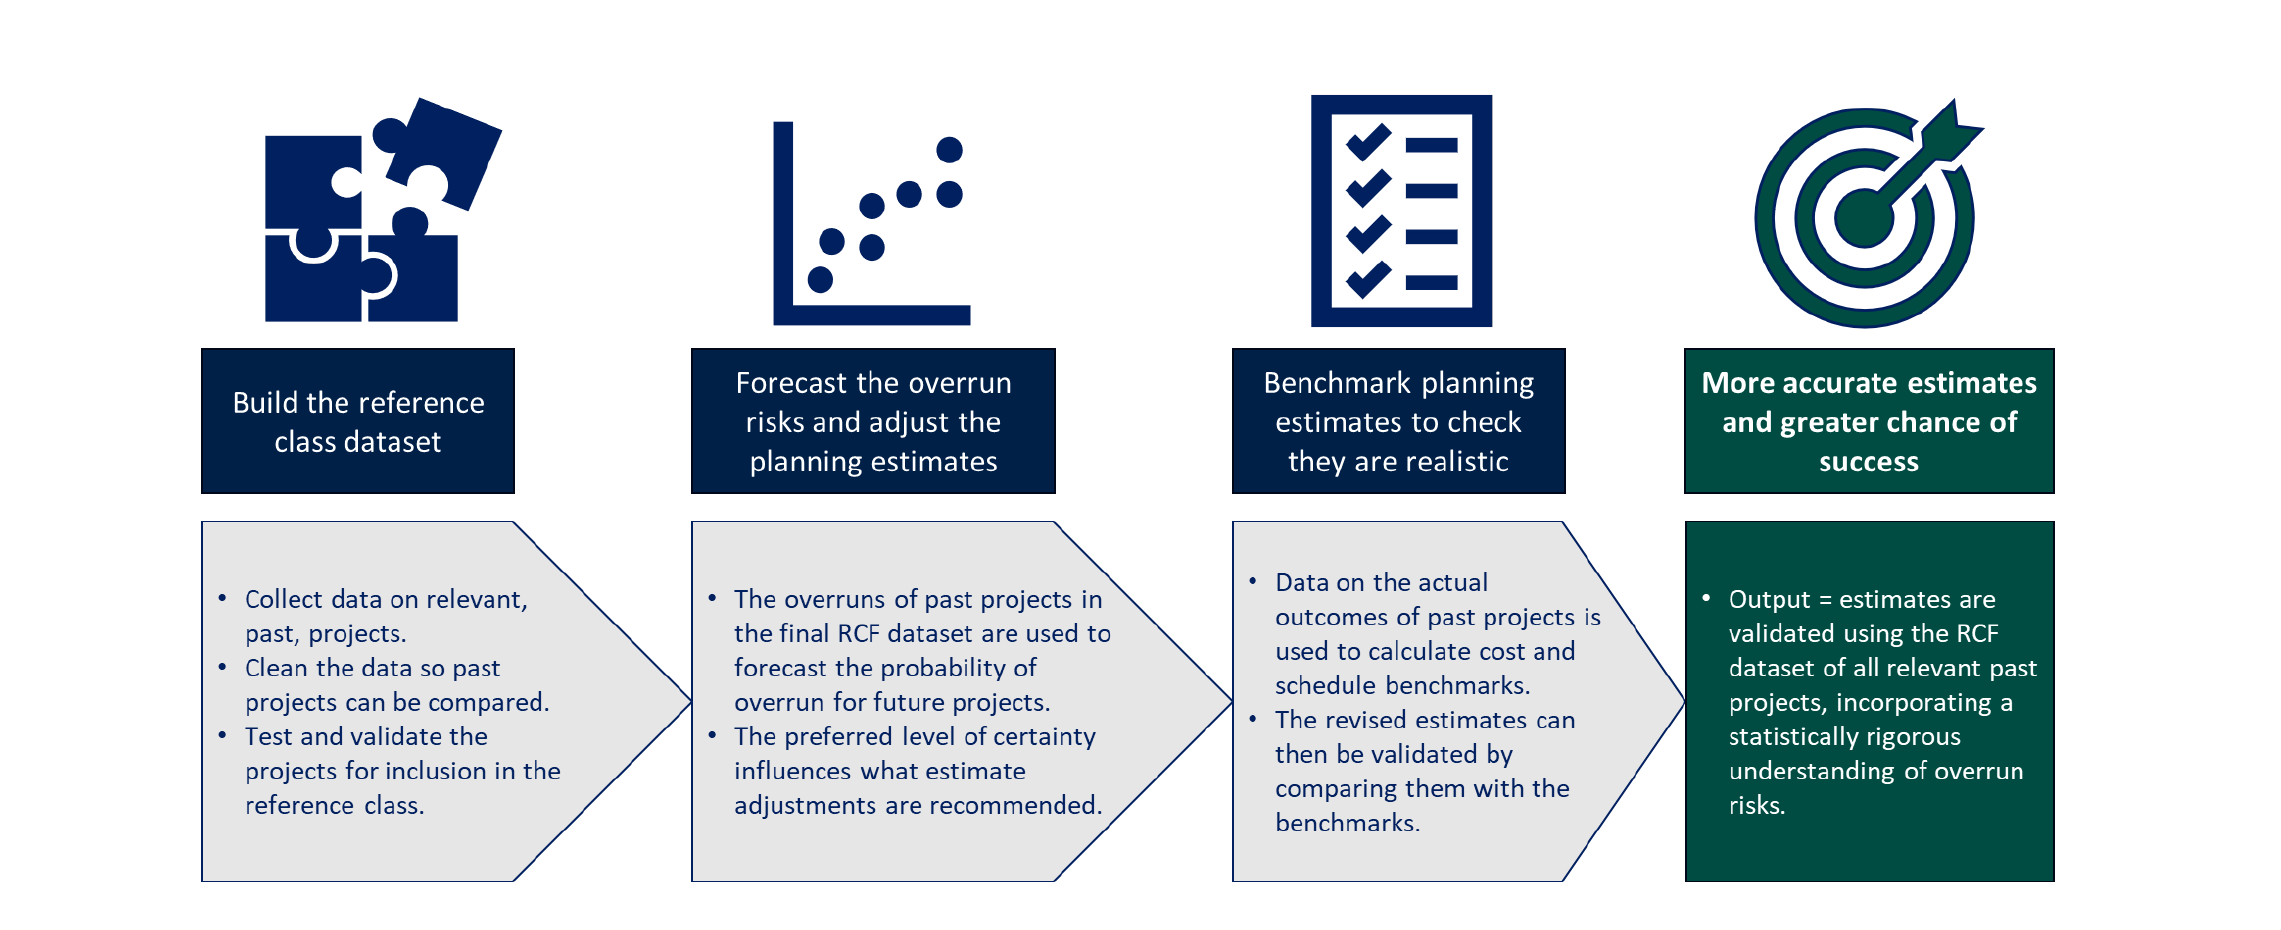
Figure 1: Key steps of our RCF approach
Table 1: Final number of BRT and Urban Rail projects included in our analyses
| Outcome variables | Unit | Number of BRT projects | Number of Urban Rail projects |
|---|---|---|---|
| Cost benchmarking | $ / Km | 49 | 149 |
| Cost Overrun | % Overrun | 40 | 129 |
| Schedule benchmarking | Km / Year | 66 | 152 |
| Schedule Overrun | % Overrun | 46 | 26 |
Our findings provide critical insights that answer key planning questions:
How likely is a cost or schedule overrun on a planned project?
Compared to estimates at the final investment decision, 40% of BRT projects stayed within budget, and just 20% opened on time. For Urban Rail projects, only 25% stayed within budget, all heavy rail projects opened late, and half of light rail projects had delays. This means that most projects will cost more and take longer than planned, regardless of location, type, or year of construction.
By how much could a planned project overrun?
Half of the BRT projects exceeded their budgets by 5% or less, and their schedules by 17% or less, when compared to final investment decision estimates. However, 1 in 5 BRT projects saw cost overruns of 30% or more and schedule overruns of 62% or more.
In comparison, Urban Rail projects have worse cost control. Half exceeded their budgets by 17% or less, and 1 in 5 experienced cost overruns of 54% or more. In terms of schedule overrun, light rail is better than BRT, but heavy rail is much worse.
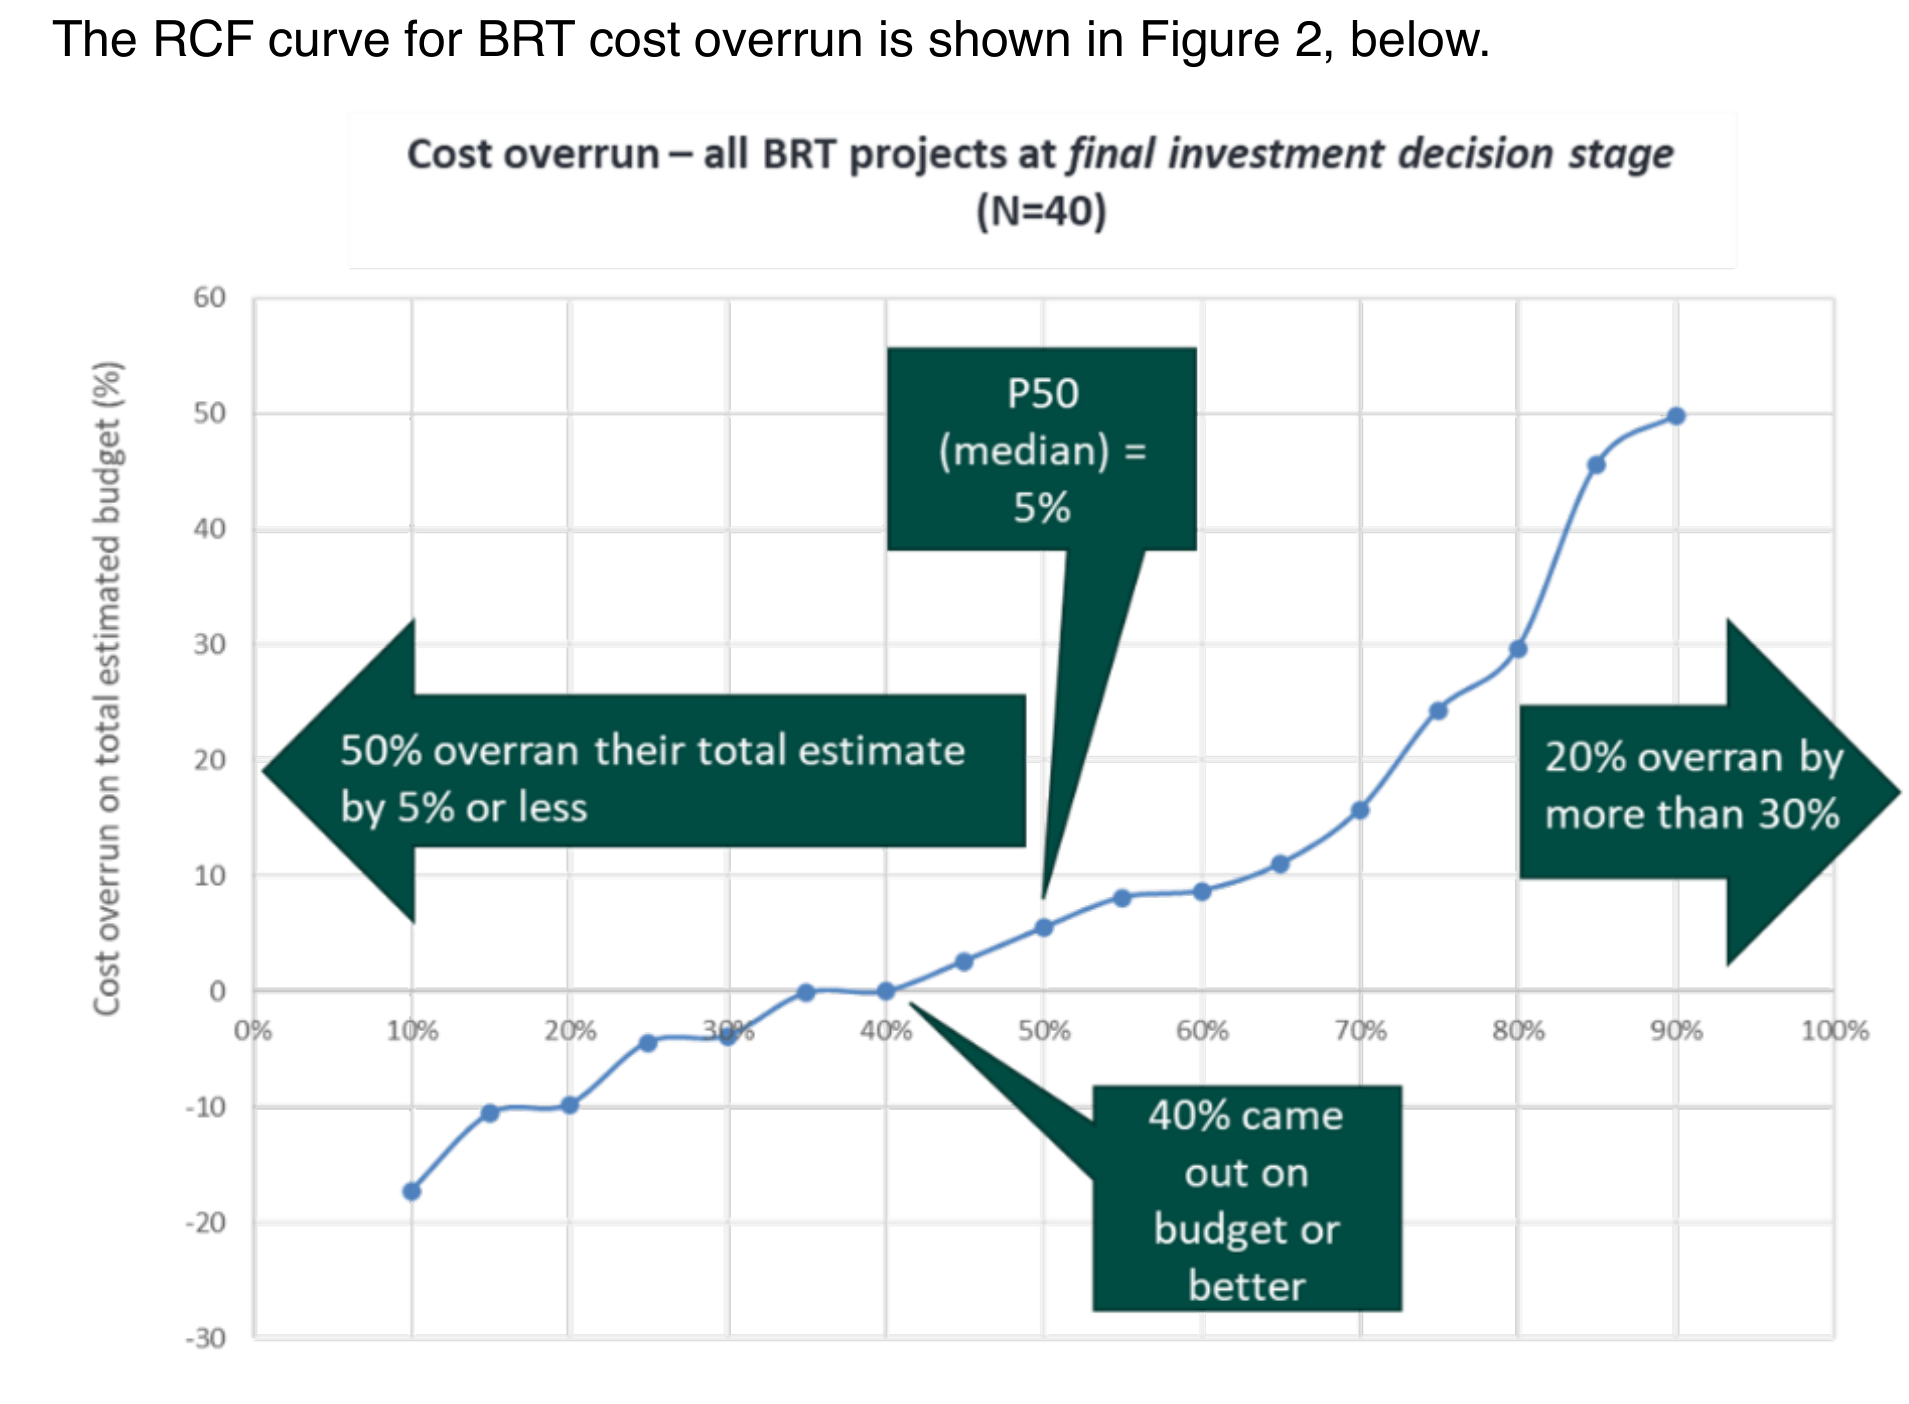
Figure 2: Cost overrun – all BRT projects at final investment decision stage
Typically, it is recommended that projects consider certainties between 60% and 80%. 30-50% certainty levels may be considered to incentivise performance or target setting for contractors. 50-60% certainties may be allocated to project managers to work towards. Then we usually recommend that projects hold higher levels of contingency (certainties of 60-80%) in reserve. 80-90% certainty may be considered if a project has a very low risk appetite or can be used to simulate the impact of worse case scenarios. We do not recommend projects use certainties above 90% because these become very expensive and are better mitigated through careful risk management of high impact but rare events (Black Swan management).
Typically, it is recommended that projects consider certainties between 60% and 80%. 50-60% may be considered to incentivise performance or target setting for contractors, but we usually recommend that projects hold higher levels of contingency in reserve. 80-90% certainty may be considered if a project has a very low risk appetite or can be used to simulate the impact of worse case scenarios. We do not recommend projects use certainties above the 90% because these become very expensive and are better mitigated through careful risk management of high impact but rare events (Black Swan Management).
For a general guide to selection of certainty levels, see the table below.
Table 2: General guide to selecting desired certainty of no overrun
| Project appraisal question | Risk appetite | Certainty of no overrun | Suggested use |
|---|---|---|---|
| Target setting to incentivise performance | Moderate to high risk | 30-50% | Low level of contingency provided to contractors or project management to incentivise performance and avoid "consumption" of contingency. |
| Median or QRA Most Likely comparison | Moderate risk appetite | 50% | Contingency required assuming performance in the middle of the reference class. Helpful comparison against a QRA P50 or Most Likely scenario. |
| Standalone project / tiered contingency | Moderate to Low risk | 60-80% | Often used for standalone projects with no access to portfolio/programme funds if they overrun. Contingency at P60 and above often held as tiered contingency, not immediately available. |
| Affordability in worst case scenario or very low risk appetite | Very low risk | 80-95% | Used for stress testing economic or financial appraisals to see what would happen in a worst-case scenario. Occasionally used for contingency by high-profile projects with fixed budget envelopes. |
Colour coding is provided to help with the interpretation:
Please note that this colour coding is provided to help with interpretation of the outputs. It does not indicate an error with inputs or highlight if the tool is used incorrectly. Also note that recommended ranges are generic and for guidance purposes only. Projects should always select certainty levels suitable for their specific circumstances. If a user is having difficulty deciding on certainties for their project, we recommend contacting UK Government Centre of Expertise for Green Cities and Infrastructure programmes to request additional support.
After the risk of a cost or schedule overrun is understood and uplifts have been added, the next step is to benchmark the final estimates. This is done to check that your final estimates are realistic when compared to past similar projects.
If estimates are low compared to the benchmark: you could be underestimating your cost or schedule and the RCF uplifts may not be enough to prevent an overrun.
If your estimates are high compared to the benchmark: you could be overestimating your cost and schedule and the RCF uplifts may be increasing your budget or schedule more than necessary.
If you find that your budget or schedule may be under or over-estimated, you should carefully review your estimate to understand why this is happening and only progress when you are satisfied that your estimate is robust.
Reasons that estimates coming out as high or low compared to the benchmarks should be objectively justified. For example:
If a planned project's benchmark position cannot be justified and still appears to fall in an inappropriate position on the benchmarks, we recommend carefully reviewing the estimate to check if cost or schedule should be added to or removed from the estimate and any contingencies.
An RCF uplift should only be added once the estimate is confirmed to be robust. If a user is having difficulty benchmarking their project, we recommend contacting UK Government Centre of Expertise for Green Cities and Infrastructure programmes to request additional support.
Table 3: Influence of length categories on benchmarking
| Benchmark | Length categories | Benchmarking implications |
|---|---|---|
| BRT and Urban Rail cost benchmarks | Short = ≤ 20km Long = > 20km |
Statistical analysis finds that the longer the BRT or UR route, the lower the cost/km. This is accounted for by splitting the RCFs into short and long categories. However, if a planned project is particularly short for its category (e.g. 3km in the ≤ 20km category) or just above the threshold (e.g. 23km in the > 20km category), it is likely to show as unusually expensive per km. The reverse is true for projects that are particularly long for their category. |
| BRT productivity benchmarks | Short = ≤ 13km Medium = 13-25km Long = > 25km |
Statistical analysis finds that the longer the BRT route, the higher the productivity. This is accounted for by splitting the RCFs into short, medium, and long categories. However, if a planned project is particularly short for its category (e.g. 3km in the ≤ 13km category or 14km in the 13-25km category), it is likely to show as unusually slow. The reverse is true for projects that are particularly long for their category. |
| Urban Rail productivity benchmarks | Short = ≤ 20km Long = > 20km |
Statistical analysis finds that the longer the UR route, the higher the productivity. This is accounted for by splitting the RCFs into short and long categories. However, if a planned project is particularly short for its category (e.g. 3km in the ≤ 20km category or 23km in the > 20km category), it is likely to show as unusually slow per km. The reverse is true for projects that are particularly long for their category. |